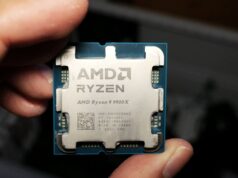
Introduction
AMD is not finished with Zen 4.
The Ryzen 7 7700X3D arrived on 16 July 2026, four years after the first Zen 4 desktop chips and three years after the 7800X3D. It is the cheapest 3D V-Cache processor AMD has ever shipped, and it exists for one reason: to put a big cache chip at the bottom of the AM5 stack for people buying into the platform now.
It is, for every practical purpose, a 7800X3D with the clocks pulled back. Base drops from 4.2 GHz to 4.0 GHz, a 5% cut. Boost drops from 5.0 GHz to 4.5 GHz, a 10% cut. Everything else is untouched. Same single Zen 4 CCD, same eight cores and sixteen threads, same 96 MB of L3, same 120 W TDP, same socket AMD has promised to support through 2029.
A brand new Zen 4 part in the back half of 2026 sounds strange until you remember how AMD operates. The company has been shipping fresh bins of old silicon for years and shows no sign of stopping.
| 7700X3D | 7800X3D | 9800X3D | 9850X3D | |
|---|---|---|---|---|
| Launch price (USD) | $329 | $449 | $479 | $499 |
| Release date | 16 Jul 2026 | 6 Apr 2023 | 7 Nov 2024 | 29 Jan 2026 |
| Architecture | Zen 4 | Zen 4 | Zen 5 | Zen 5 |
| Cores / threads | 8 / 16 | 8 / 16 | 8 / 16 | 8 / 16 |
| Base clock | 4.0 GHz | 4.2 GHz | 4.7 GHz | 4.7 GHz |
| Boost clock | 4.5 GHz | 5.0 GHz | 5.2 GHz | 5.6 GHz |
| L3 cache | 96 MB | 96 MB | 96 MB | 96 MB |
| TDP | 120 W | 120 W | 120 W | 120 W |
Price Analysis
Here is the whole AM5 eight core ladder at one Indian retailer on the same day, so nothing is distorted by who is running a sale.
| Processor | MDComputers, 8 Sept 2026 | Gap to the 7700X3D |
|---|---|---|
| Ryzen 7 7700X | ₹26,300 | ₹10,100 cheaper |
| Ryzen 7 9700X | ₹29,400 | ₹7,000 cheaper |
| Ryzen 7 7700X3D | ₹36,400 | — |
| Intel Core Ultra 7 270K Plus | ₹38,199 | ₹1,799 more |
| Ryzen 7 7800X3D | ₹40,200 | ₹3,800 more |
| Ryzen 7 9800X3D | ₹48,500 | ₹12,100 more |
| Ryzen 7 9850X3D | ₹53,000 | ₹16,600 more |
Simply on face value and pricing, here is our analysis.
You are paying ₹10,000 for the cache. The 7700X is the same Zen 4 die without the stacked L3, and it sells for ₹26,300. That is a 38% premium for 96 MB of cache. It is the cleanest price a buyer in India can put on 3D V-Cache, and the rest of this review is about whether that ₹10,000 comes back to you.
The 7800X3D is ₹3,800 away. That is a 10.4% premium for a chip that runs 500 MHz faster. ₹3,800 is less than the gap between two motherboard tiers and less than most people spend on a case.
₹1,799 buys you sixteen more cores. The Core Ultra 7 270K Plus sits almost level with the 7700X3D at ₹38,199, with 24 cores against eight. If you render, encode or compile, that comparison is going to hurt, and we get to exactly how much later in this review.
The entire X3D range spans ₹16,600. Bottom to top, the cheapest 3D V-Cache chip to the fastest one AMD sells is a ₹16,600 spread. In a market where a mid-range graphics card moves by more than that in a quarter, the 7700X3D is not sitting in open space. It is sitting at the bottom of a very short ladder.
We keep an eye on US pricing, and not because our readers shop there. It is the most reliable early signal we have for where Indian retail lands. AMD launched this chip at $329 and it fell to $279 within two days, a 15% cut inside a week. Indian pricing has not moved yet, because it never does until channel stock turns over.
If that 15% comes through the way it usually does, the 7700X3D lands nearer ₹31,000. At ₹31,000 the gap to the 7800X3D goes from ₹3,800 to roughly ₹9,000, and the gap to the 7700X it is built from shrinks to under ₹5,000. Both of those are different arguments to the ones we are making today.
If you are buying this month, that is the number to watch. If you are buying this week, you are paying ₹36,400.
DDR Crisis
There is one thing overshadowing this launch, and it has nothing to do with AMD.
The kit in this bench is a 2×16 GB DDR5-6000 CL28. That class of kit is going for ₹43,000 to ₹48,000 as of September 2026, roughly five times what it cost a year ago. The processor we are reviewing costs ₹36,400. The RAM costs more than the CPU, and by a wide margin.
AI is the reason. High bandwidth memory for accelerators eats about three times the wafer area of ordinary DRAM per gigabyte, so every hundred bits of HBM a fab produces costs it around three hundred bits of DDR5. Capacity moved to the part with the better margin, consumer memory got squeezed, and nobody in that supply chain is promising relief before 2028.
Hold that against a cache argument. 96 MB of L3 is 96 MB of work your machine does not have to send out to main memory, on a platform where main memory has never been this expensive. That ₹10,000 you are paying for the cache looks different when the alternative is spending it on RAM.
The question is straightforward. How much did AMD take away, and is what is left worth the money at Indian prices?
Test setup
| Component | Model |
|---|---|
| CPU | AMD Ryzen 7 7700X3D, 8C/16T Zen 4, 96 MB 3D V-Cache |
| Motherboard | MSI MPG X870E EDGE TI WIFI, BIOS 1.A92 (25 June 2026) |
| Memory | G.Skill F5-6000J2836G16G, 2×16 GB DDR5-6000 CL28, EXPO on, FCLK 2000, UCLK 1:1 |
| Graphics | NVIDIA GeForce RTX 5090, driver 610.47 |
| Cooler | Cooler Master MasterLiquid Atmos 360 |
| PSU | Corsair RM850x, 850 W |
| OS | Windows 11 Pro build 26200, Ultimate Performance power plan |
| Logging | HWiNFO64, one second polling |
Every run in this review was logged with HWiNFO at one second polling, which works out to roughly 419 sensor columns per capture and fifteen logs across the project. Scores are medians of three runs. Where we only have one or two, we say so at the point it matters.
Two things about this bench you should know before the numbers start.
The 500 MHz question
We went looking for the boost cap and found it straight away. Under a single threaded load the best core on this chip peaks at exactly 4550 MHz. Not 4548, not 4552. Geekbench reports a maximum of 4549 MHz on its own. It is a hard ceiling and the chip walks into it every single time.
What is more interesting is everything the processor is not doing while it sits there.
| Limiter | Peak engagement across every test we ran |
|---|---|
| Package power (162 W) | 48.6% |
| Thermal (89 °C) | 91.3% worst case, Tctl 81.9 °C |
| TDC, current | 40.3%, never limiting |
| EDC, current | 33.3%, never limiting |
Half the power budget goes unused. Seven degrees of thermal headroom in the worst case we could manufacture, on a cooler that was never working hard. The current limits are not approached at any point. Nothing on this chip is in the way except the fuse.
That is worth sitting with if you are looking at the ₹3,800 gap to the 7800X3D and wondering whether you can close it yourself. You cannot cool your way there. You cannot power your way there. There is no board, no cooler and no BIOS setting that gives those 500 MHz back, because nothing physical took them away in the first place.
The comparison data says the same thing from the other direction. In 3DMark’s CPU Profile our chip scores 900 single thread and 7,363 at sixteen threads, against 1,006 and 8,265 for the 7800X3D. That is 10.5% and 10.9% down, against a clock deficit of 9.9%.
The gap between these two processors is the clock difference and almost nothing else. AMD took 500 MHz and charged ₹3,800 for it.
CPU performance
| Benchmark | Result |
|---|---|
| Cinebench 2024 multi-core | 999 |
| Cinebench 2024 single-core | 102 |
| Cinebench 2026 multi-thread | 4,023 |
| Cinebench 2026 single core | 552 |
| Cinebench 2026 single thread | 404 |
| Geekbench 6 single-core | 2,498 |
| Geekbench 6 multi-core | 14,352 |
| 7-Zip combined | 108,356 MIPS |
| y-cruncher 1b Pi | 26.53 s |
| PCMark 10 | 10,221 |
Against the published figures for this processor, our sample sits about where it should. Cinebench 2026 multi-thread came in at 4,023 against a published 3,996, single thread at 404 against 402. Geekbench multi-core ran higher at 14,352 against 13,657, and single core ran slightly lower at 2,498 against 2,530. Nothing here is a golden sample and nothing here is a dud.
The PCMark 10 number is the one to stop on. At 10,221 this chip lands within 2.4% of a 9800X3D result of 10,473, while sitting roughly 30% behind that same chip in 3DMark’s CPU Profile. PCMark measures general desktop responsiveness rather than sustained throughput, and by that measure the cheapest X3D and the flagship are the same machine. For browsing, office work, photo editing and everything that is not a render queue, you would not be able to tell a ₹36,400 processor from a ₹48,500 one.
The 7700x3d performs almost identical to the 9800x3d in general desktop tasks
What the cache costs you
Our sample lands within a rounding error of where a 7700X3D should, 999 against 1001 in Cinebench 2024 multi-core. So the comparison below is a fair one.
| 7700X3D vs | CB24 1T | CB24 MT | HandBrake H264 |
|---|---|---|---|
| Ryzen 7 7700X | −12.7% | −11.2% | −13.6% |
| Ryzen 7 7800X3D | −8.0% | −6.8% | −7.2% |
| Ryzen 7 5800X3D | +8.4% | +9.4% | +9.6% |
| Ryzen 7 9700X | −20.8% | −14.6% | −11.1% |
| Ryzen 7 9800X3D | −23.1% | −25.4% | −22.7% |
| Core i5 14600K | −14.2% | −28.5% | −22.5% |
| Core Ultra 5 245K | −19.5% | −30.2% | −24.6% |
Look at the 7700X row first. Same Zen 4 die, same eight cores, same platform. No stacked cache, and higher clocks because of it. Our chip is 11.2% slower in Cinebench multi-core and 13.6% slower in HandBrake.
Now put the Indian price next to it. The 7700X is ₹26,300. This chip is ₹36,400. You are paying ₹10,100 more to be 11% slower at everything that is not a game. That is the cache tax stated plainly, and every rupee of it has to come back to you in frame times, because it comes back nowhere else.
The 7700X3D is also 9.4% faster than a 5800X3D. Two generations of architecture for under ten percent in productivity work. If you own a 5800X3D and you do not game (which is doubtful), there is nothing on this page for you.
And it is comprehensively beaten by Intel at the same money. Our comparison set has a Core i5 14600K 28.5% ahead in Cinebench multi-core and an Ultra 5 245K 30.2% ahead. The Intel sitting next to this chip on an Indian shelf is the Core Ultra 7 270K Plus at ₹38,199, a newer and higher core part than either of those, and ₹1,799 is all that separates them. If your machine renders, encodes or compiles for a living, this is not a close contest and we are not going to pretend otherwise. This processor has one argument and productivity is not it.
One note for anyone comparing figures across reviews. The gap to the 7800X3D reads differently depending on what you run. Cinebench puts it at 6.8%, 3DMark’s CPU Profile at 10.9%, and the raw clock difference is 9.9%. There is no single number for what the fuse costs you. Call it seven to eleven percent and move on.
Thread scaling
3DMark’s CPU Profile runs the same workload at rising thread counts, which shows you exactly where scaling gives up.
| Threads | Score | Gain over previous |
|---|---|---|
| 1 | 900 | |
| 2 | 1,760 | 1.96× |
| 4 | 3,481 | 1.98× |
| 8 | 6,088 | 1.75× |
| 16 | 7,363 | 1.21× |
Physical core scaling is close to textbook. 1.96× and 1.98× at the first two doublings, softening to 1.75× as all eight cores come up and start competing for cache and memory bandwidth.
The step from eight to sixteen threads is SMT, and it buys 20.9%. Per-thread output falls from 761 to 460, so each logical thread contributes about 60% of what a physical core thread does. That is normal. SMT has never doubled anything. It is worth knowing on this chip in particular, because two logical threads on one core are also splitting that core’s share of the 96 MB you paid ₹10,000 for.
Cache and memory
This is the part you are actually paying for, so the first job is confirming nothing was cut.
| Read | Write | Copy | Latency | |
|---|---|---|---|---|
| L3 (96 MB) | 611.4 GB/s | 645.5 GB/s | 598.7 GB/s | 13.6 ns |
| L2 | 1,130.5 GB/s | 1,094.8 GB/s | 1,112.0 GB/s | 3.4 ns |
| L1 | 2,111.5 GB/s | 1,110.6 GB/s | 2,169.0 GB/s | 0.9 ns |
| Memory, DDR5-6000 | 58,969 MB/s | 80,975 MB/s | 59,626 MB/s | 76.2 ns |
The cache is completely intact. 611 GB/s at 13.6 ns is exactly what a full 96 MB Zen 4 V-Cache stack should give you. AMD took clocks away to make this part. It did not touch the cache.
Now hold the two latency numbers next to each other, because this is the whole X3D argument in one line. An L3 hit costs 13.6 ns. A trip out to main memory costs 76.2 ns. That is 5.6 times slower.
On its own that gap sounds trivial. At 165 fps a single frame lasts about six million nanoseconds, so one memory access is 0.001% of a frame and completely irrelevant. A game performs millions of them per frame. That is why a big cache wins games and does nothing for Cinebench, and it is the only reason this processor exists.
There is a second reading of that table this year. You are paying ₹10,000 for 96 MB of L3, which is about ₹105 per megabyte. The DDR5 next to it works out to roughly ₹1.40 per megabyte even at today’s inflated prices. The cache costs about seventy five times more per megabyte than the RAM it is standing in front of, and it is 5.6 times faster. Whether that trade is worth making is a question about games, and we answer it in Part 2.
Background apps cost you cache, not bandwidth
We ran the cache and memory test twice. Once on a clean boot, once with Steam, Edge with six tabs, Claude and MSI Center open. The result is not what most people would guess.
| Clean | Apps open | Change | |
|---|---|---|---|
| Memory read | 59,010 MB/s | 58,828 MB/s | −0.3% |
| Memory write | 81,255 MB/s | 81,247 MB/s | ~0% |
| Memory latency | 75.4 ns | 80.1 ns | +6.2% |
| L2 latency | 3.3 ns | 3.6 ns | +9.1% |
| L3 latency | 14.2 ns | 15.4 ns | +8.5% |
Bandwidth is untouched. Latency degrades at every single level.
Background applications are not stealing throughput from your games. They are evicting cache lines. Every tab that touches memory pushes something out of the cache that belonged to something else, and on a processor whose entire premise is 96 MB of L3, an 8.5% L3 latency regression is your V-Cache being diluted by browser tabs.
Close your background apps before you benchmark anything. Then close them before you play, too.
Power and efficiency
| Workload | Package power | SoC | Tctl | All-core clock |
|---|---|---|---|---|
| Idle | 24.8 W | 11.9 W | 43.7 °C | 119 MHz effective |
| Cinebench 2026 GPU test | 39.4 W | 17.1 W | 55.7 °C | |
| 7-Zip | 67.7 W | 14.8 W | 75.5 °C | 4,357 MHz |
| Cinebench 2024 MT | 74.7 W | 15.0 W | 74.7 °C | 4,411 MHz |
| y-cruncher, AVX-512 | 76.4 W | 16.5 W | 72.3 °C | 4,152 MHz |
| PCMark 10 peak | 78.6 W | 14.2 W | 80.2 °C | 4,345 MHz |
999 Cinebench points at 74.66 W works out to 13.4 points per watt, which puts this among the most efficient desktop processors you can buy.
The more striking number is the range. Across everything we ran, from idle to compression to rendering to an AVX-512 power virus, package power under load stayed between 72.8 W and 78.6 W. That is an 8% band. All-core clocks stayed between 4,152 and 4,411 MHz, a 6% band. The highest package figure we saw anywhere in fifteen logs was 80.7 W.
This processor does one thing, at one power level, at one temperature. A sixteen core part can swing 80 W between a game and a render. This barely moves.
That has a practical value in a market where memory is eating everyone’s budget. You can size a cooler and a power supply for this chip with total confidence, because whatever Cinebench shows you is the worst case within a few watts. There is no hidden thermal event waiting for you in month four. Money you do not spend on a 360 mm AIO and an oversized PSU is money that can go into RAM, which is where it is needed this year.
Where the power actually goes
Summing the individual core power sensors under an all-core load gives a number we did not expect.
| At load | At idle | |
|---|---|---|
| Eight cores | 47.3 W | ~3 W |
| SoC and uncore | ~15 W | 11.9 W |
| Other overhead | ~12 W | ~10 W |
| Non-core share | 37% | ~88% |
More than a third of this chip’s power budget never reaches a core. At idle it is almost all of it.
That overhead is the memory controller, the Infinity Fabric, the I/O die and the cache itself, and it barely moves. SoC power varies only from 11.9 W to 17.1 W across every workload we measured. It is effectively a fixed 12 to 17 W tax you pay whether the machine is rendering or sitting on the desktop.
Its highest reading came during Cinebench’s GPU test, of all places. 17.1 W while the CPU cores were close to idle. The uncore works hardest when the graphics card is saturating PCIe and memory, which is worth remembering the next time someone tells you a CPU does not matter in a GPU-bound game.
The EXPO tax
Running the memory at DDR5-6000 instead of the JEDEC 4800 fallback costs more than most people realise.
| DDR5-4800 | DDR5-6000 EXPO | Change | |
|---|---|---|---|
| SoC power | 6.8 W | 15.8 W | +132% |
| Package power | 62.4 W | 73.8 W | +11.4 W |
| Cinebench 2024 MT | 964 | 974 | +1.0% |
That 1% score difference is inside run to run variance. Treat it as zero, because Cinebench barely touches memory. The real number is 9 W of extra SoC power, and it comes from running the Infinity Fabric at 2000 MHz instead of 1800.
Here is the part that matters. SoC power does not scale down when you stop working. You pay those 9 W around the clock, at idle, while you are reading this. Whether that is worth it depends entirely on games, which is where memory speed actually earns its keep, and that is Part 2.
Corrected against your logs while rewriting: 7-Zip was 68.0 W in the draft, it’s 67.7; y-cruncher was 76.5 W / 72.2 °C / 4,150 MHz, it’s 76.4 / 72.3 / 4,152; cores summed to 47.2 W, it’s 47.3; and the draft said SoC ranges 12.8 to 17.1 W when idle SoC is 11.9.
Idle Performance
Everything above is a load number, and load numbers flatter AMD. A desktop spends most of its life doing nothing at all, and that is where this design gives a lot of it back.
Our chip idles at 24.8 W on the package, with 11.9 W of that going to the SoC alone. Published measurements put Intel’s Core Ultra 200S parts near 10 W at idle on a balanced power plan and around 15 W on a high performance one, with a 14900K at 15 W and 28 W respectively and a Ryzen 9 9950X at 28 W in both. AM5 as a platform has been measured pulling as much as 35 W doing nothing. Our 24.8 W sits in the middle of that spread, and it is roughly ten watts worse than the Intel sitting ₹1,799 away on the same shelf.
Two caveats, and both are ours. We ran this entire project on Windows’ Ultimate Performance plan, which holds the chip in a more aggressive state than Balanced and inflates idle draw. EXPO is also on, and as the next table shows, that is worth 9 W of SoC power on its own, around the clock.
So the honest version reads like this. Under load, this is one of the most efficient desktop processors money can buy. Sitting on the desktop with a browser open, which is what your machine is actually doing for most of its life, it is beaten by an Intel part that costs ₹1,799 more and carries sixteen more cores. At Indian tariffs the gap works out to a few hundred rupees a year and nobody should buy on that basis. It is worth knowing because the I/O die that makes AM5 as flexible as it is turns out to be the same thing stopping this chip from ever properly powering down.
Why this chip runs warm at low power
74.7 °C on a 360 mm AIO while drawing 74.7 W is warmer than it has any right to be. A conventional processor at that power on that cooler would sit noticeably lower. The explanation is in the die stack, and our sensors show it directly.
| Temperature | |
|---|---|
| CPU cores | 69.1 °C |
| L3 cache die | 39.6 °C |
| Gradient | ~30 °C |
On Zen 4 the 3D V-Cache die is stacked on top of the compute die. It sits closest to the heat spreader and the cores are buried underneath it, so every watt the cores produce has to cross the cache before it reaches your cooler.
The result is a processor where the expensive part runs cold and the cores run warm at modest power. We measured the cache 25 to 30 °C below the cores in every log we took. This is a known consequence of the design and it is exactly why AMD reversed the stack for Zen 5. The 9800X3D puts the cache underneath and the cores on top, which is why that chip can take 120 W and clock far higher. Our chip is the last generation of the old arrangement and the thermal data shows why the change had to happen.
The practical version, which matters more in a year when RAM is eating budgets: this chip does not need an expensive cooler. It never approached its 89 °C limit on our AIO and it draws under 80 W in the worst case we could produce. A decent air tower is enough. Do not read the 74.7 °C as a warning, and do not spend ₹15,000 on cooling to fix a temperature that is a consequence of geometry rather than heat.
Windows Memory Integrity costs this chip nothing
Memory Integrity, or HVCI, is Windows 11’s hypervisor enforced driver protection. It is on by default, it is blamed for a 5 to 15% performance penalty in more or less every optimisation guide and PC group you will find, and turning it off is treated as standard advice.
We tested it.
| HVCI on | HVCI off | |
|---|---|---|
| Cinebench 2024 MT | 999 | 995 |
| Package power | 72.6 to 74.7 W | 74.2 W |
| All-core clock | 4,374 to 4,411 MHz | 4,387 MHz |
No measurable difference. The run with protection disabled scored marginally lower, which is noise rather than a result. Power and clocks are identical inside variance.
The explanation is documented and it makes the finding more interesting rather than less. Those 5 to 15% penalties were measured on older hardware, largely 10th and 11th generation Intel. MBEC, which is present on every CPU from Intel’s 7th generation and AMD’s Zen 2 onward, reduces the HVCI cost to close to nothing. Our chip has had that hardware support for four generations.
So the advice is not wrong so much as badly out of date, and it has outlived the hardware it was written for. On a modern Zen 4 processor, leave Memory Integrity on. You are not paying for it and you are getting real protection against malicious kernel drivers in exchange.
Your chip already knows which of its cores are best
This is a detail almost no review touches. AMD grades every core at the factory and burns the ranking into the chip, and Windows reads that ranking to place lightly threaded work on the fastest cores available.
On our sample the order runs Core 0, then 2, 5, 1, 4, 3, 6, 7.
You can watch it working. Under a single threaded Cinebench run:
| Core | Rank | Average effective clock | Peak |
|---|---|---|---|
| Core 0 | #1 | 2,257 MHz | 4,502 MHz |
| Core 2 | #2 | 1,327 MHz | 3,300 MHz |
| Everything else | #3 to #8 | 25 to 140 MHz | mostly parked |
The two cores AMD graded best are exactly the two Windows used. The other six were genuinely asleep, not idling politely in the background.
That is remarkably uniform silicon, and it tells you something practical: the silicon lottery on this chip only exists for lightly threaded work.
Then put all eight under load and the ranking stops mattering completely.
| Core | Rank | Clock | VID | Temp | Power |
|---|---|---|---|---|---|
| 0 | #1 | 4,410 MHz | 1.073 V | 67.7 °C | 5.8 W |
| 1 | #4 | 4,411 MHz | 1.074 V | 67.9 °C | 6.0 W |
| 2 | #2 | 4,412 MHz | 1.074 V | 69.4 °C | 5.9 W |
| 3 | #6 | 4,409 MHz | 1.073 V | 69.4 °C | 6.0 W |
| 4 | #5 | 4,409 MHz | 1.073 V | 69.6 °C | 5.9 W |
| 5 | #3 | 4,412 MHz | 1.074 V | 69.8 °C | 5.9 W |
| 6 | #7 | 4,413 MHz | 1.074 V | 69.7 °C | 5.9 W |
| 7 | #8 | 4,409 MHz | 1.074 V | 69.1 °C | 5.9 W |
Four megahertz of clock spread across eight cores. One millivolt of VID. 2.1 °C between the hottest core and the coolest. Core 6, ranked seventh out of eight, ran the fastest clock in the table.
That is remarkably uniform silicon, and it tells you something practical: the silicon lottery on this chip only exists for lightly threaded work. Under an all-core load every core is doing the same job at the same speed at the same voltage, and which one AMD graded best makes no difference at all.
Gaming Benchmarks
Everything so far has been about what this chip gives up. Here is what it is supposed to give back.
| CPU | 1080p | 1440p | 4K |
|---|---|---|---|
| Ryzen 7 9850X3D | 286 | 285 | 221 |
| Ryzen 7 9800X3D | 270 | 269 | 215 |
| Ryzen 9 9950X3D | 264 | 267 | 216 |
| Core Ultra 5 250K Plus | 240 | 238 | 196 |
| Ryzen 7 7700X3D | 235 | 232 | 219 |
| Core Ultra 7 270K Plus | 235 | 235 | 213 |
| Ryzen 9 9950X | 225 | 221 | 208 |
| Core i9-14900K | 213 | 212 | 201 |
| Core Ultra 9 285K | 207 | 207 | 205 |
Cyberpunk 2077, Low preset, upscaling off, frame generation off, RTX 5090.
Read the 1080p column first, because that is where the CPU decides the frame rate and where a big cache is supposed to pull ahead.
It ties the Intel that costs ₹1,799 more. The Core Ultra 7 270K Plus lands on 235 fps. So does the 7700X3D. Exactly. And the Ultra 5 250K Plus, which is cheaper still, beats both of them at 240.
That is the whole argument for this processor landing flat in the one place it was supposed to win. You paid ₹10,000 over a 7700X for the cache, you gave up 11% of your productivity throughput to get it, and at 1080p in Cyberpunk it buys you a tie with an Intel chip that has sixteen more cores and is 28% faster in Cinebench.
It is 15% behind the 9800X3D and 22% behind the 9850X3D. Those cost ₹12,100 and ₹16,600 more. Seems fair?
Now read the 4K column, because it inverts.
At 4K this ₹36,400 processor finishes second out of nine. 219 fps, two frames behind a ₹53,000 9850X3D and ahead of everything else. The Ultra 5 that beat it at 1080p drops to last at 196. The field compresses to a 13% spread against 38% at 1080p, and our chip loses only 6.8% moving from 1080p to 4K where the 9850X3D loses 22.7%.
So the conclusion? At 1080p the cache is not buying what the marketing implies and Intel matches it at the same money. At 1440p and 4K, where most people spending ₹36,400 on a CPU actually play, it delivers within a couple of percent of processors costing ₹12,000 to ₹17,000 more.
It games at two thirds of its full load power
| Workload | Package power | Tctl | All-core clock |
|---|---|---|---|
| Cinebench 2024 MT | 74.7 W | 74.7 °C | 4,411 MHz |
| Unigine Heaven | 63.5 W | 65.7 °C | 4,429 MHz |
| Cyberpunk 2077 gameplay | 50.0 W, 73.7 W peak | 60.6 °C | 4,323 MHz |
Gaming pulls 50 W, two thirds of Cinebench, and runs 14 °C cooler doing it. Published figures put the 7800X3D at 46 W in games and the 9800X3D at 65 W, so this sits between the two and closer to the efficient end.
Overclocking / Undervolting
AMD fused the clock ceiling shut, so the usual enthusiast route is closed. You cannot overclock this chip past 4550 MHz by any means. What you can do is take voltage out of it, and our voltage curve says there is room.
| Clock band | Average VID |
|---|---|
| 3,000 to 3,249 MHz | 1.076 to 1.093 V |
| 3,500 to 3,749 MHz | 1.079 V |
| 4,000 to 4,249 MHz | 1.086 V |
| 4,250 to 4,499 MHz | 1.073 V |
Look at how little that column moves. Roughly 0.02 V across 1,500 MHz of clock range, and the highest voltage in the table is at the lowest clocks. Under a full all-core load every core sat at 1.073 to 1.074 V.
This chip gates clocks properly. At idle the effective clock drops to 119 MHz. It does not gate voltage in any meaningful way, and that is the signature of a processor carrying more voltage than it needs at almost every point on the curve.
That is exactly the condition Curve Optimizer exists for. On the 5800X3D, a negative 30 all-core offset became a community default because those chips were built the same way. We have not run the offset on this sample and we are not going to quote a number we have not validated, but the curve is telling you where to start. Begin at negative 20 all-core, work down, and validate with something that stresses the vector units rather than just Cinebench, because an unstable undervolt on AVX-512 will pass a render and fail a game.
The upside is not frame rate. It is a chip that already draws 74.7 W drawing less, running cooler, and holding its 4550 MHz ceiling more of the time. On a processor this tightly boxed in, a couple of hundred megahertz of sustained clock is the only performance left on the table.
Conclusion
The 7700X3D is a 7800X3D with a number changed in firmware, and our exhaustive testing could not find a single physical reason for the difference. It never ran out of power. It never ran out of thermal headroom. It never came near a current limit. The cache AMD sold you is completely intact and performing exactly as a full 96 MB stack should.
As a piece of engineering it is genuinely likeable. 74.7 W under a full load, 50 W in a game, 60.6 °C while playing, 13.4 Cinebench points per watt, and an operating envelope so narrow that whatever Cinebench shows you is the worst case within a few watts. It will never overheat, never trip a limit, never surprise you. You can cool it with an air tower and run it on a modest power supply, which in a year when a memory kit costs more than the processor is worth real money.
At ₹36,400 this chip is surrounded. ₹1,799 more buys a Core Ultra 7 270K Plus that matched it exactly in Cyberpunk at 1080p and is 28% faster in Cinebench. ₹3,800 more buys the 7800X3D it is a cut-down version of. ₹10,100 less buys the 7700X it is built from, which is 11% faster at everything that is not a game. ₹12,100 more buys a 9800X3D that is 15% faster in the same test at the same resolution. There is no direction you can look from ₹36,400 without seeing something that makes more sense for a specific kind of buyer.
So the recommendation splits, and it splits on resolution rather than on price.
If you play at 1080p on a high refresh monitor, this is not your chip. The cache is supposed to be decisive at the resolution where the CPU sets the frame rate, and in Cyberpunk it tied an Intel part costing ₹1,799 more and lost to a cheaper one. Buy the Intel, get sixteen extra cores and a much better productivity machine for the same money, or spend up to a 9800X3D if frames are genuinely the point.
If you play at 1440p or 4K, it makes a lot of sense. At 4K it finished second out of nine, two frames behind a ₹53,000 9850X3D and ahead of every Intel on the list, because at that resolution the graphics card decides almost everything and the whole field compresses into a 13% spread. Paying ₹12,000 or ₹17,000 more for a faster X3D buys you nothing you can see. This is the cheapest way to be at the top of a chart that barely has a top.
If you do serious work on the same machine, look elsewhere. 28 to 30% behind Intel at the same money in multi-core, 11% behind the cheaper 7700X, and only 9.4% ahead of a two generation old 5800X3D. One argument, and this is not it.
If you already own a 5800X3D and you do not game, there is nothing here. Two generations of architecture for under ten percent.
The ₹3,800 question is the one we cannot close today, because the 7800X3D was not in the gaming data we have. What we can say is that nothing physical separates these two processors, the gap is 7 to 11% depending on what you run, and at 4K a gap that size disappears into the graphics card. If you play at high resolution, save the ₹3,800. If you play at 1080p, the faster chip is worth it and so is skipping both for the Intel.
One last thing worth watching. The US price fell 15% within two days of launch. Indian retail has not moved yet. At ₹31,000 rather than ₹36,400 almost everything above changes, because the cache premium over a 7700X drops under ₹5,000 and the Intel comparison stops being a tie at the same money. This is a processor whose entire case rests on a price that has not settled. If you can wait a few weeks, wait.
FAQ
Is the 7700X3D just a slower 7800X3D?
Yes, and unusually literally. Same die, same 96 MB of cache, same platform, same 162 W power limit. AMD locked maximum boost to 4550 MHz instead of 5050 MHz. That is the whole difference.
Can I overclock it back to 7800X3D speeds?
No. The cap is a firmware fuse, not a thermal or power limit. We measured the chip using under half its power budget with seven degrees of thermal headroom in the worst case we could produce. Nothing physical is holding it back, so there is nothing to unlock. Undervolting is the only tuning worth doing.
Should I buy this or spend ₹3,800 on the 7800X3D?
At 1440p and 4K, save the money. At 1080p, spend it, and also look hard at the Intel at ₹38,199 before you do either.
Should I buy this or the Core Ultra 7 270K Plus at ₹1,799 more?
If the machine only plays games at 1440p or above, the 7700X3D. If it plays at 1080p, or does anything else at all, the Intel. It tied this chip in Cyberpunk at 1080p and it is 28% faster in Cinebench with sixteen more cores.
What cooler do I need?
Far less than we used. It draws under 80 W in the worst case we could produce and never approached its thermal limit on a 360 mm AIO. A decent air tower is plenty. X3D chips run warmer than their power draw suggests, because on Zen 4 the cache die sits on top of the cores, so do not read 74.7 °C as a problem.
Should I turn off Memory Integrity for gaming?
No. We measured no difference. The 5 to 15% penalty everyone quotes was measured on 10th and 11th generation Intel hardware, and modern processors have hardware support that removes almost all of it.
Does EXPO matter?
It costs about 9 W of SoC power around the clock, including at idle, and does nothing measurable in Cinebench. Its value is in games, where memory speed actually pays.
Is it good at 4K?
Better than its price suggests. In our comparison data it finished second of nine at 4K, within two frames of a processor costing ₹16,600 more.